
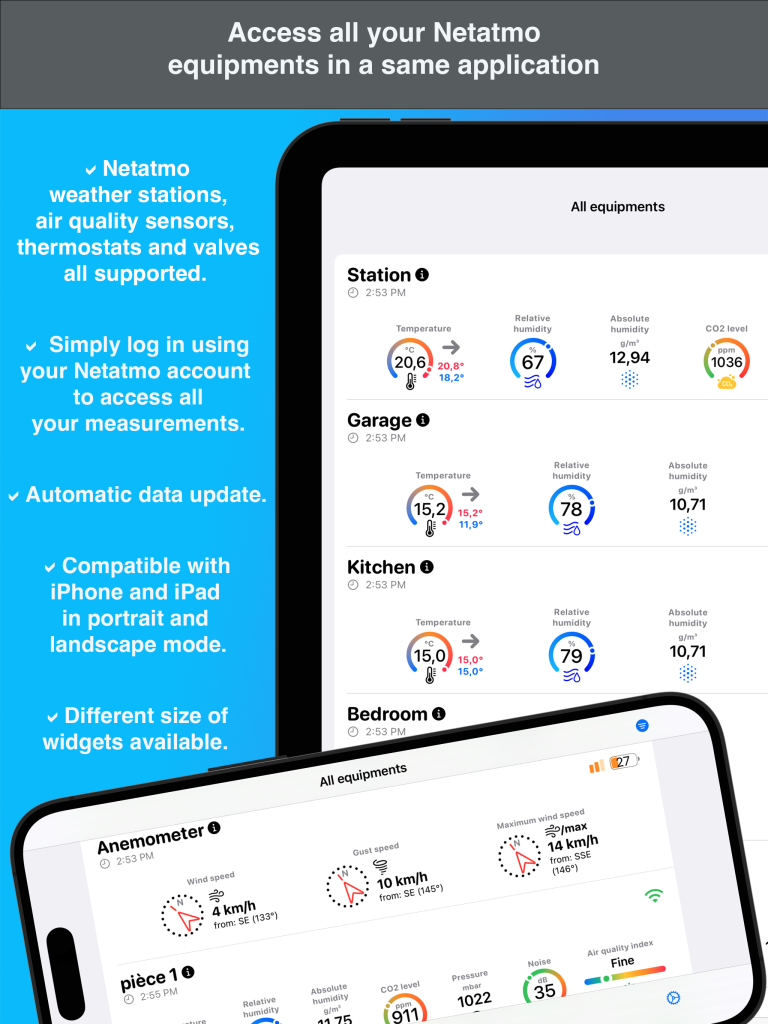
View all your Netatmo equipments in the same application !
Compatibility :
HomeAtmo is available for iPhone, iPad and Mac OS versions !
This application is compatible with the Netatmo Weather station (and additional modules), the air quality sensor (Aircare or Healthy Home Coach), the Netatmo thermostats and valves. You just need to use your Netatmo account to connect.
Features :
HomeAtmo is a smart application that lets you always keep an eye on your Netatmo equipments from the Weahter, Aircare or Energy range.
Very easy to use, you authenticate directly with your Netatmo account.
The application always remains visible in your menu bar and displays the measurements taken in real time. With a simple click on this measurement bar, you access a clear and detailed dashboard.
Dashboard :
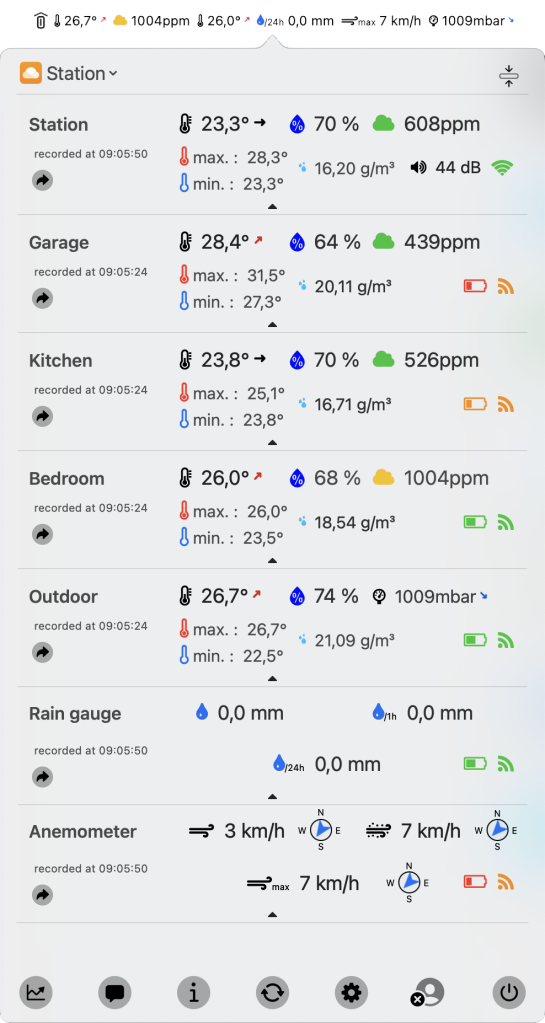
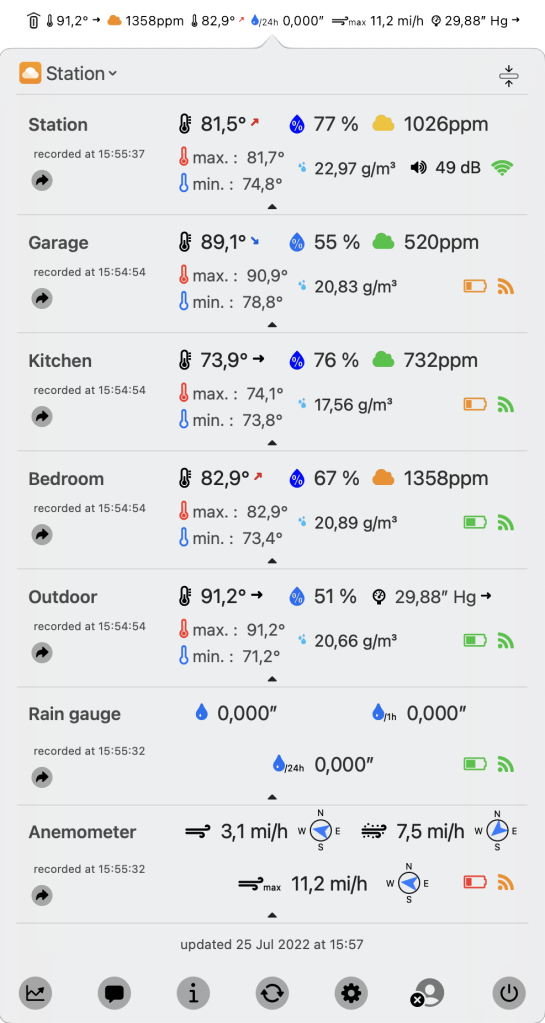
The HomeAtmo dashboard has been developed to offer a synthetic view and to be able to compare the values of the same nature of the different sensors with each other. For example, you can compare the humidity of your different sensors at a glance.
Mac OS version :
Examples of the HomeAtmo interface with different units of measurement used :
iPhone/iPad version :
Measurements bar (Mac OS only):
Similarly, you can choose the type of information that will be displayed in the menu bar. Two types of menu bar are now available :
– The Standard menu bar which allows you to select up to 2 measurements in the menu bar amongst the current temperature and the current temperature with trend for the main station and the outdoor sensor. The display order is also configurable.
– The Premium menu bar that allows you to select up to 6 measurements to be displayed in the menu bar amongst any sensor and measurement type available. You choose the display order in the bar, so the customization is total. The Premium measurement bar is available through an in-app purchase (integrated in the HomeAtmo application).
Premium bar example :

To make it easier for you to distinguish the measurements you have selected to be displayed in the menu bar, some information is now displayed when you let your cursor a few seconds on the menu bar.
You will get :
– the type of measurement.
– the sensor concerned.
– the time of the last measurement
For minimum and maximum temperature measurements as well as for maximum wind speed, the measurement time is the exact time of the value that was recorded.
In addition, if you leave your cursor a few seconds on the HomeAtmo icon in the bar, you will get the information of the version of the application, as well as the latency of Netatmo servers in response to your network requests.
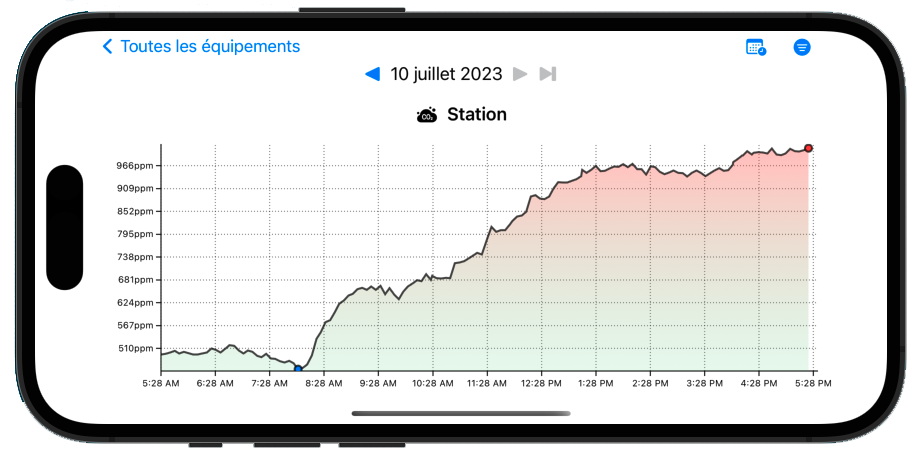
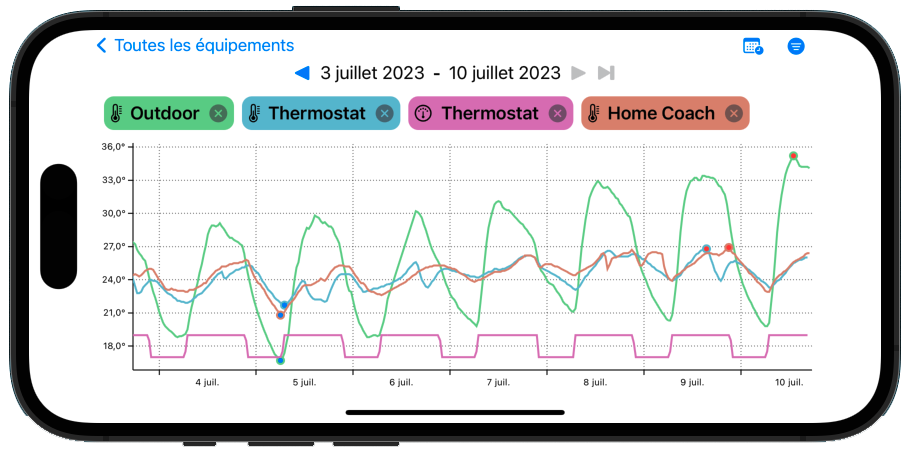
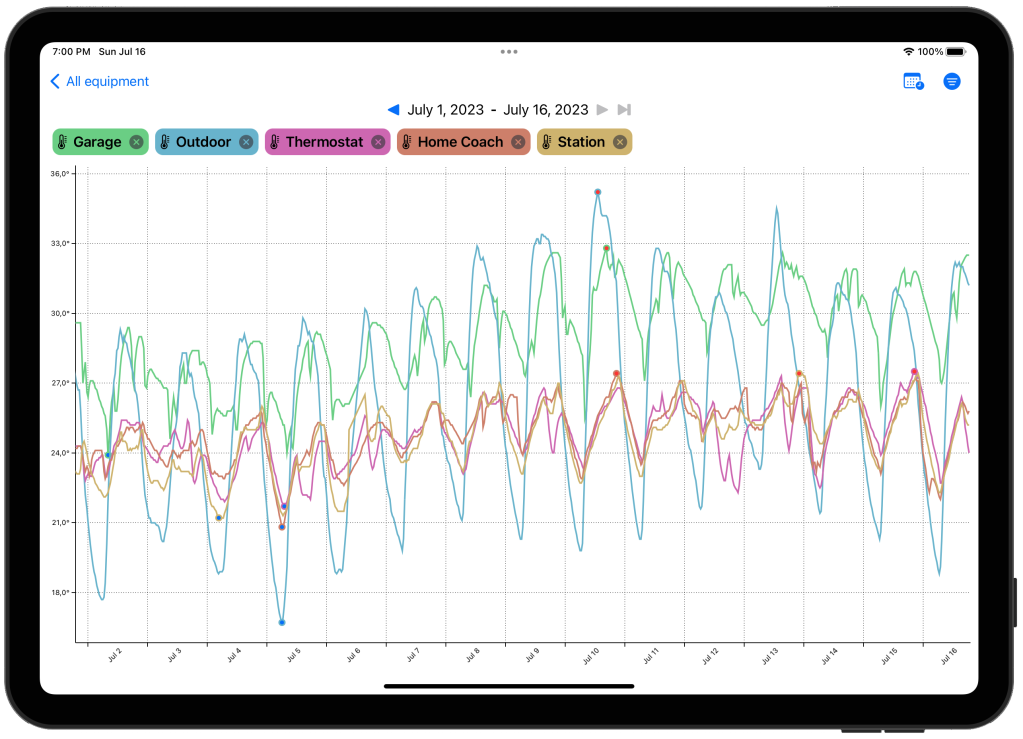
Charts (iPhone/iPad):
HomeAtmo also gives you access to your measurement history through multi-curve graphs:
You can display up to 5 curves on the same graph for the same type of measurement, by selecting the sensors of your choice!
You have access to multi-curve display for temperature, setpoint temperature, CO2, relative and absolute humidity, noise, atmospheric pressure, cumulative precipitation as well as wind speed and gusts.
You can select the viewing period of your choice: 12 hours, 24 hours, 72 hours, 7 days, 15 days, 30 days, 90 days, 6 months and 1 year, and scroll through your measurement history.
The graphs are accessible exclusively with the HomeAtmo full version in-app purchase.
Charts examples :
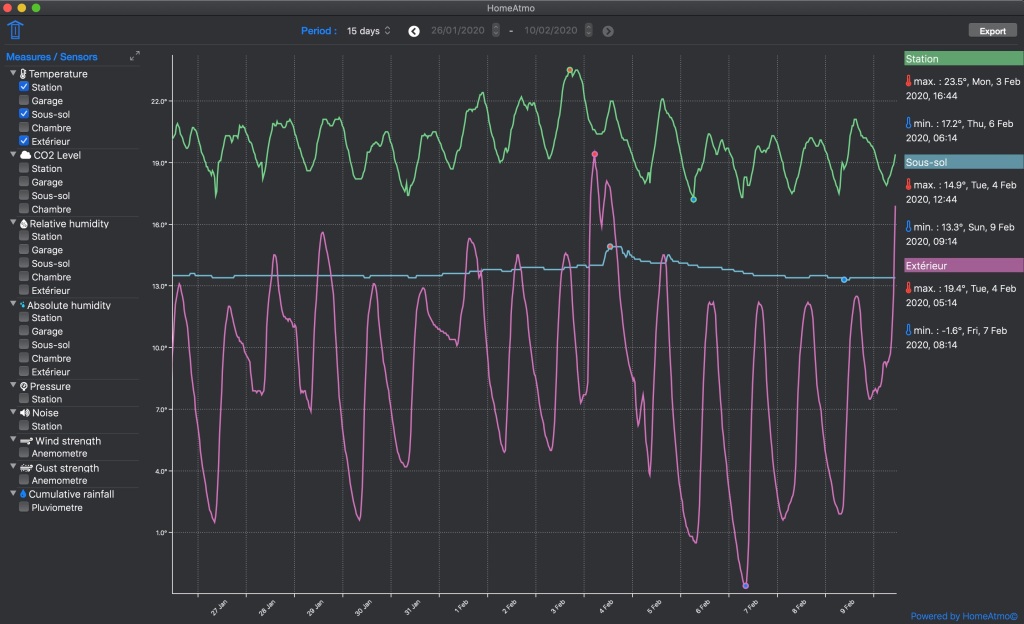
Charts (Mac OS):
Unlike HomeAtmo Lite that has no graph capabilities, the standard version of HomeAtmo can display the curves of your measurements: a simple click on the measurement of your choice in the dashboard and you get the associated graph.
You can adjust the display size of your graphs and even view them in full screen !
By default, you can view the temperature curve of the station, aircare module, thermostat, valve and outdoor sensor over the last twelve hours.
With the in-app purchase “HomeAtmo Premium Graphics”, you have access to the curves of all your Netatmo measurements for the period of your choice, namely measurement curves for :
- temperature
- CO2 level
- humidity level
- absolute humidity
- acoustic comfort
- atmospheric pressure
- set point temperature (for the thermostat or the valve)
- precipitation cumulative (for the rain gauge)
- the wind speed and gust speed (for the anemometer)
You can select the time period of your choice for the graphs ie :
- 12 hours, 24 hours or 72 hours
- 7 days, 15 days, 30 days or 90 days
- 6 months or 1 year
You may also move through the history of your measurements up to 10 years !
A multi-curve display feature is available allowing you to view the curves for the same type of measurement of all your equipments on the same graph: with the HomeAtmo Premium Graph in-app purchase, the multi-curve mode is available for each type of measurement.
Depending on the measurements displayed, you can view, on the right handside of the graph window : the average, the total or the minimum and maximum values on the selected period.
An interactive cursor also allows you to view the measurements figures at a given time even in multi-curve mode.
Chart example :
The application also makes it easy to switch between displaying data from one Weather station/Aircare sensor to another if you have linked several equipments to the same Netatmo account.
Configuration :
To use this application, you must first have at least one Netatmo equipment configured and have created an account on the Netatmo site netatmo.com.
HomeAtmo application supports Netatmo account’s user preferences for measurement units.
By changing the choice of your units in the “setting” menu on the netatmo.com website, the HomeAtmo application will automatically display the measurements in the desired units. You will may get :
- temperatures in C ° or F °.
- pressure in mbar, inHg, mmHg.
- measure of rain precipitation in mm or inch.
- wind speed in km/h, mph, m/s, knot.
